Low carbon electricity is probably the greatest enabler of Net Zero as well as the key for many of humanity’s ambitions beyond climate. Most models of net zero electricity grids assume at least 70-80% penetration of wind and solar. Hitting those sorts of levels assumes rapid and sustained acceleration of generation capacity as well as expanding the grid 2-3 fold as more sectors of the economy are electrified. Whilst this poses multiple challenges around raw materials (see post on Copper) and industrial mobilisation, there are grounds for optimism that industry can be sufficiently mobilised (evidenced by the huge build out of the EV and battery manufacturing capacity) and increasing innovation around resource extraction and use can anticipate and negate bottlenecks there. However, the challenges around stakeholder management and political will to deploy wind and solar at the scale necessary is in some ways trickier and is less tractable to innovation. I touched on land-use constraints in a previous post here, although mostly in the context of the difficulties of transmission construction, but am revisiting it here in light of some excellent work done by Lucid Catalyst, showing that the land availability and public acceptance constraints for new renewable projects are much more severe than I had previously realised - alarmingly so. This content was presented at a recent closed-door retreat convened by TerraPraxis and Microsoft focussed on repowering coal power plants with nuclear. The team at Lucid Catalyst kindly have allowed me to share the high-level findings here. It is an important and under-appreciated challenge for the energy transition.
The impressive historical growth of renewables
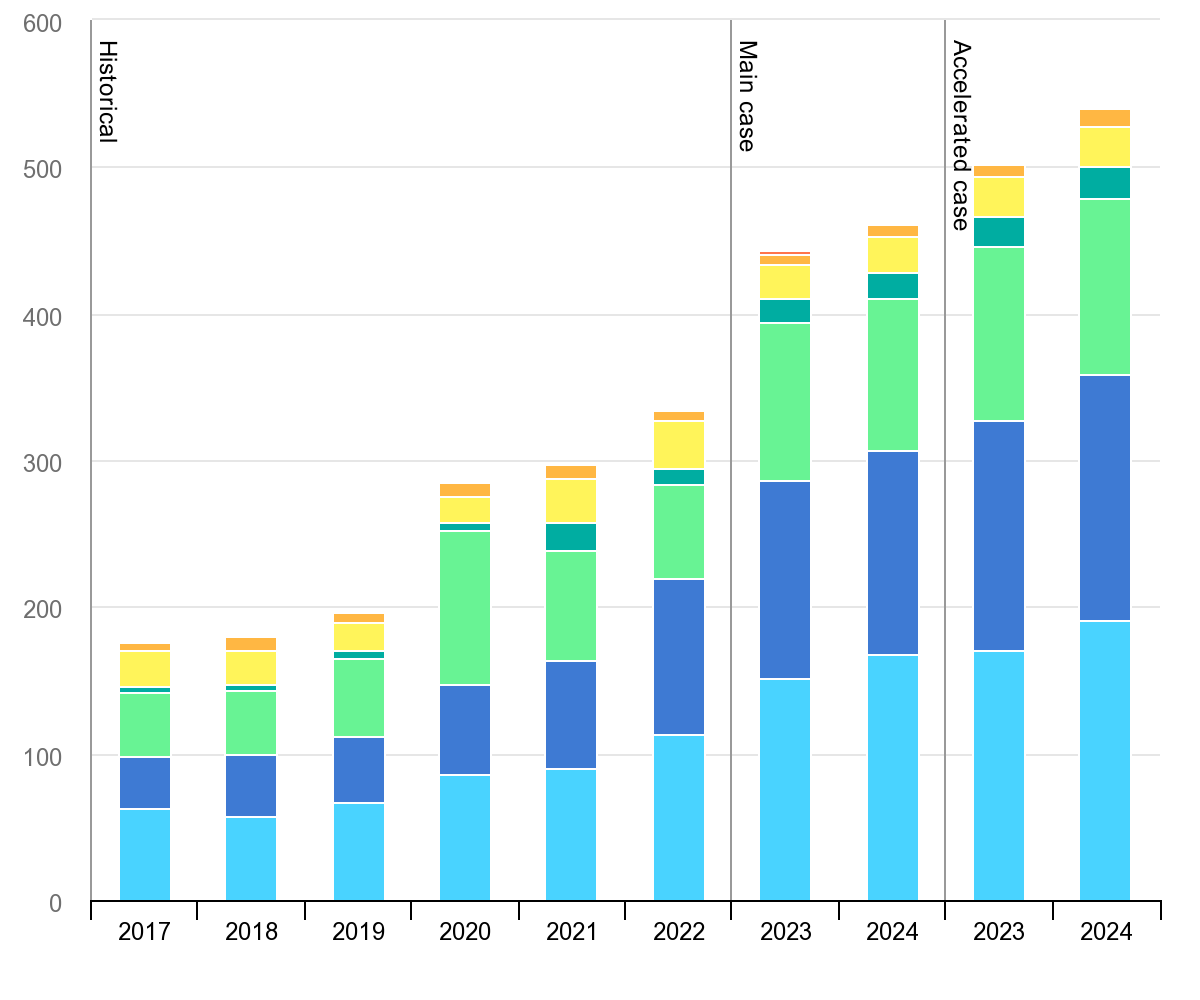
At the outset here, it is worth restating the obvious, which is that the growth of wind and (particularly) solar has been incredibly impressive and has outpaced even the most aggressive forecasts on a global basis. The IEA expect record installations again this year of 440GW globally (as usual, driven by China, representing about half of both wind and solar installations globally):
The issue in contention here is not whether or not wind and solar have a greatly expanded role to play in the future energy mix. They definitely do. The assumption that I want to stress test is whether they can realistically move from 12% of electricity generation last year up to 80% or more (even as electricity demand grows substantially), as they are required to in almost all models for Net Zero, and to do so globally, not just in smallish economies with outsized renewable resources. Let’s look, for example, at modelling by Princeton’s Net Zero America Project (NZAP). In their three central scenarios (excluding “renewables constrained” and “100% renewables”), they see solar generation in the US increasing 4-5x from 2023 levels by 2030 and 11-14x by 2040, while the same numbers for wind are 3.5x by 2030 and 6-8x by 2040.
How much land is really available?
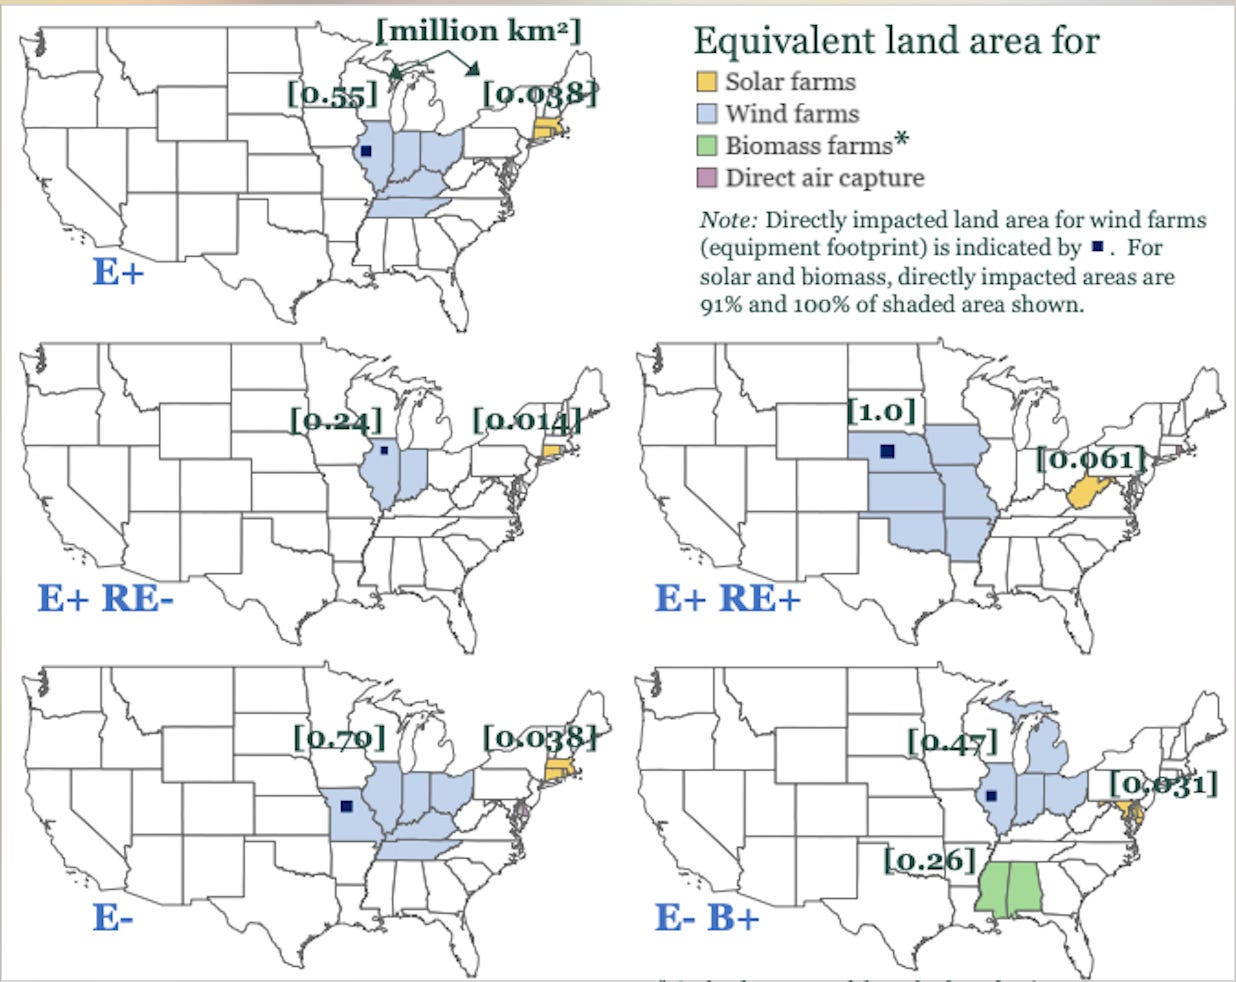
Probably many readers have seen things describing a comparatively postage-stamp size of the Sahara that could power Europe with solar, or similar such illustrations. When the numbers are calculated for the actual footprint of land required to develop wind and solar at scale, it compares reasonably favourably to overall land area. There is definitely enough surface area to build the generation capacity. However, the land requirements are still significant. For wind in particular, the impacted area is large because of the visual impact, even if the physical footprint of the turbines is smallish, and the land can be used for other things, like pasture, simultaneously. Below is the equivalent land requirement in the US as modelled by the Princeton group by mid-century under different scenarios:
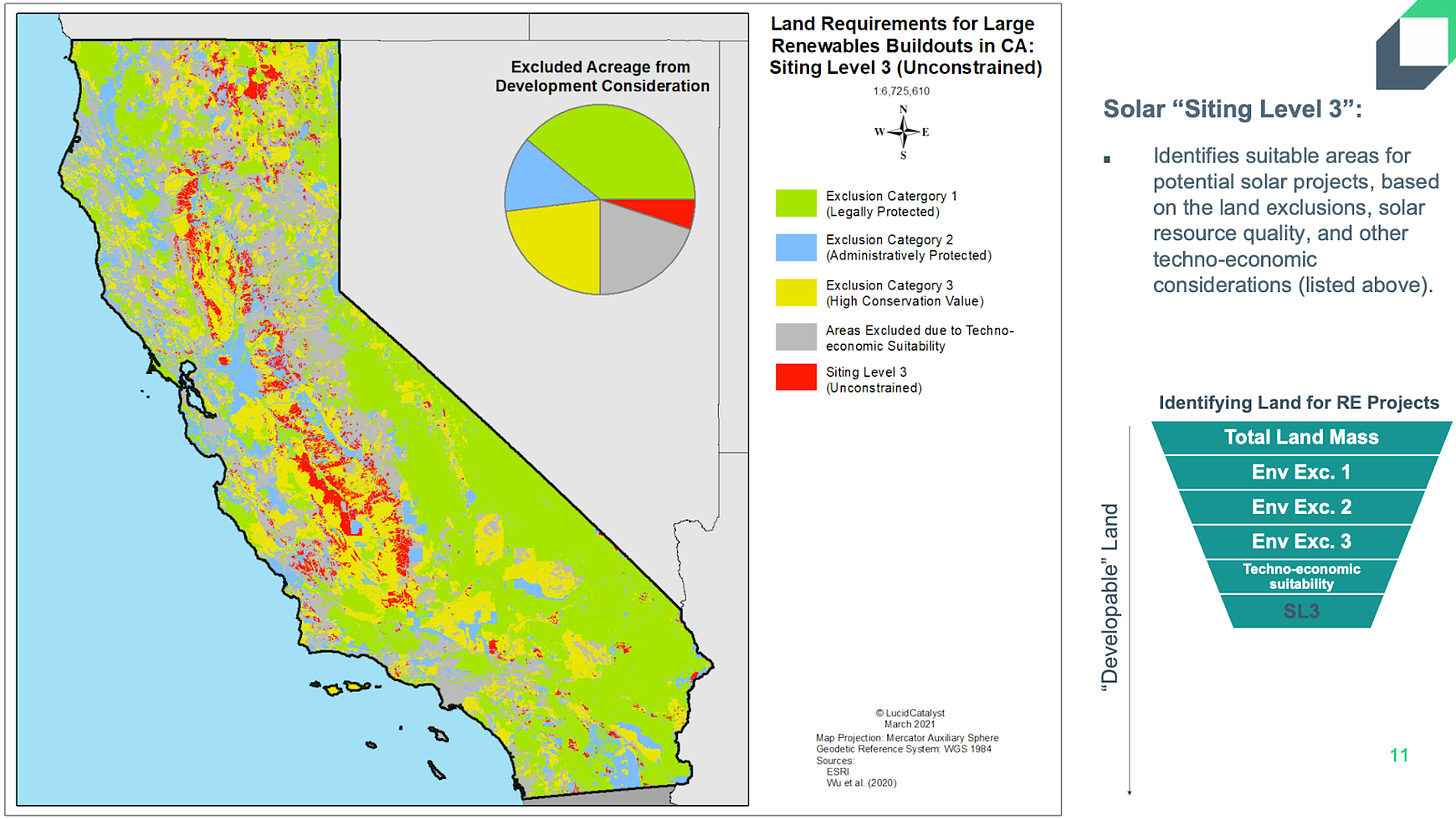
When identifying available land, we can immediately exclude large chunks for different reasons, either because of environmental or techno-economic concerns. These include land that is legally protected such as national parks, protected through local development restrictions, areas of high ecological value such as prime farmland or key habitats, and then areas where the resources are too poor or inaccessible to be economically feasible. If we take the example of California, when the various chunks are excluded to show the “siting level 3” unconstrained land availability, we are left with the area in red:
That red area represents 5 million acres or about 20,000 km^2. According to the NZAP, that will need to support about 170 GW of utility scale solar by 2050. That works out to about 20% of the unconstrained land highlighted in red above. Seems pretty doable!
Available ≠ Developable
Whilst the potentially available land should support the required generation capacity, available is not the same thing as developable. There are a number of things that developers look for when identifying attractively potential projects (courtesy of Lucid Catalyst):
Affordable land with fewer competing land uses
Amenable landowners
Large parcels, under one owner (or very few owners)
Close to transmission
Predictability in permitting (straightforward path and permitting infrastructure in place); solar ordinance/ zoning established
High capacity factors
Low construction costs (i.e., no additional site-specific expenses)
Few Right-of-Ways approvals needed
Public support
Favourable offtake agreements
All of these criteria represent a series of gates that a project needs to navigate before it gets built. Over time, aligning all of the criteria for successful projects becomes more challenging as the optimal sites are scooped up first. Furthermore certain constraints are being shown to bite earlier than might be expected. Let’s take, for instance, the inter-related topics of public support and permitting. (For sake of brevity, I’m not diving into the transmission bottle-neck here but it is substantial. I also wrote more on transmission here.)
Public support - capacity factor lower than expected - Iowa
As visible in the above image from NZAP, the land requirements for wind are substantial due to the visual impact. This means that a high proportion of land is affected in areas with the strongest resources that might export to other regions, which is the Midwest in the US. Iowa is the most extreme case, with NZAP suggesting that a little more than a third of its land (37%) would be impacted by mid-century renewables targets, but many other states (Illinois, Nebraska, Missouri, Indiana, Minnesota and Ohio) would see double digit percentages of their land area impacted. Unfortunately, the experience to date in Iowa does not inspire confidence that these mid-Western states can supply anything near the amount of wind power that is called for in different Net Zero scenarios.
Ebbing public support shows itself in the increase in local siting ordinances or setback requirements, which stipulate how far away wind turbines have to be from residential property. These can drastically curtail the available developable land even serving as an effective moratorium on development. Actual moratoriums are also possible. The below time series from Lucid Catalyst charts the increase in county-level wind siting ordinances and moratoriums. On the right hand side, note the actual installed capacity in light blue, relative to the modelled requirement under NZAP’s high electrification scenario.
At 13 GW, Iowa already has a decent amount of wind on an absolute basis, but it is still only a tenth of the mid-century goal. Opposition kicked in across most of the state between 5GW and 13GW of installed capacity. It does not seem reasonable to expect that it will be possible to build another 100GW on top of that.
Spreading Opposition
Whilst Iowa might be at the extreme end of trend, it is not exceptional. In a recent update to a report on opposition, researches at Columbia Law School note:
“local opposition to renewable energy facilities is widespread and growing, and represents a potentially significant impediment to achievement of climate goals”
A few highlights that the authors note from their report:
Between April 2022 and March 2023, at least 11 counties in Ohio adopted binding resolutions to prohibit large renewable energy projects in all of their unincorporated territories or very large swathes of those territories.
In March 2023, Buffalo County, Nebraska, adopted an exceptionally restrictive wind ordinance, which requires that turbines be set back 3 miles from the nearest property lines and 5 miles from any village or city.
In Virginia, at least 7 counties adopted restrictive solar ordinances or moratoria between June 2022 and May 2023
Across the Midwest, there has been a growing movement to prohibit solar energy systems from farmland. Since September 2022, at least two Michigan townships (LaSalle and Milan) have adopted ordinances limiting utility-scale solar energy projects to industrial districts and prohibiting such projects on land zoned for agricultural use. In neighbouring Wisconsin, four towns in Dane County (Deerfield, Dunn, Springfield, and Westport), now have policies to restrict solar from agricultural land.
There is much to celebrate in the trajectory of the renewables industry. The market continues to grow year after year, the supply chain has been substantially built out, and work is being done on permitting reform both in Europe and the US (although much remains to be done). However, it isn’t at all clear that these resources can be scaled from low-double digit to high-double digit percentages of global electricity production, even as more sectors become electrified. The positive dynamics around industrial mobilisation and economies of scale start to become offset by other factors as the best sites get developed and local acceptance starts to ebb. We need to plan accordingly. As always, comments and feedback are welcome as we all work towards getting better answers.


