

State of the Energy Transition
BNEF and Nat Bullard reports - hot off the press.

Yesterday saw the publication of two important annual stock takes on the energy transition. Bloomberg New Energy Finance (BNEF) Energy Transition Investment Trends report and Nat Bullard’s (formerly of BNEF) annual 200-slide presentation on the Energy Transition. Both reports are excellent and easy to digest, so I’d encourage readers to take a look in full. But I thought it would be worth picking out the most relevant points from each and reflecting on what they tell us about where we are at. Let’s dive in!
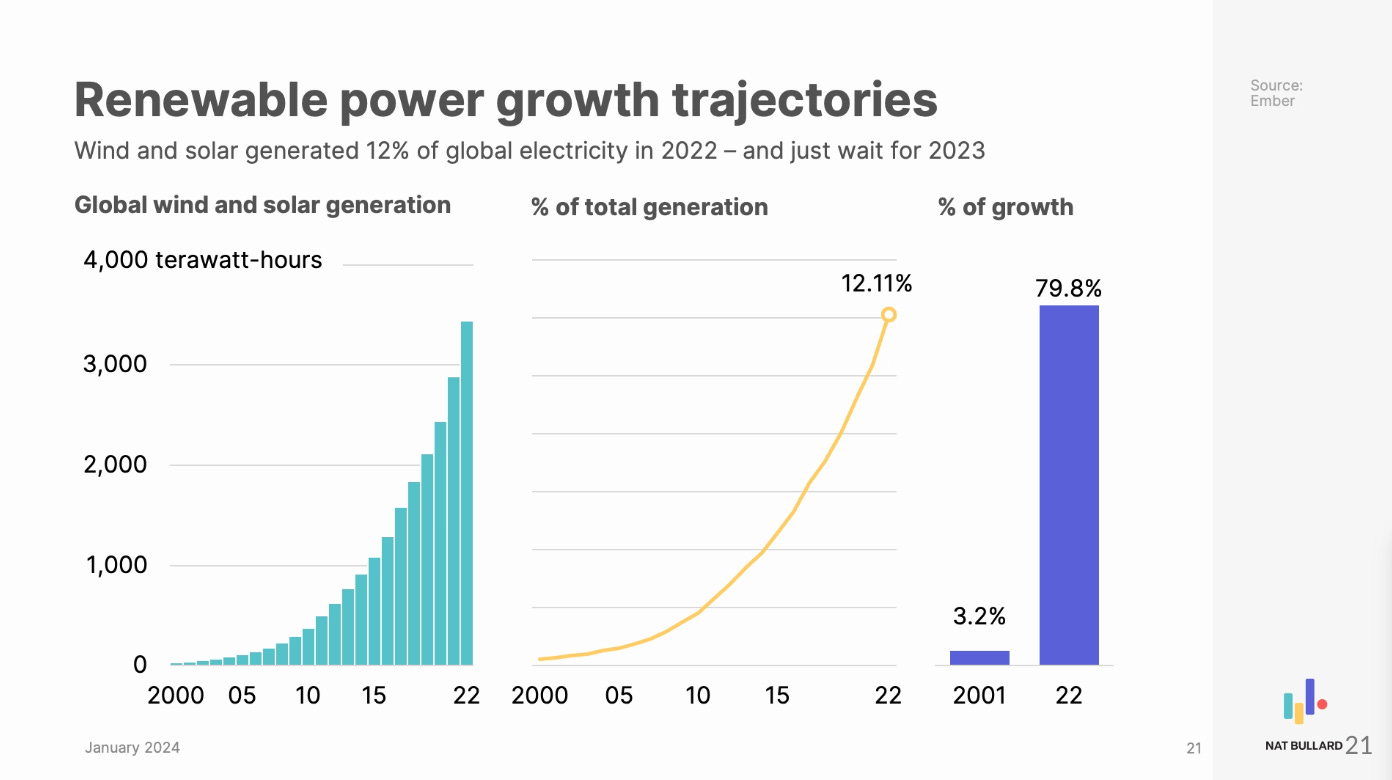
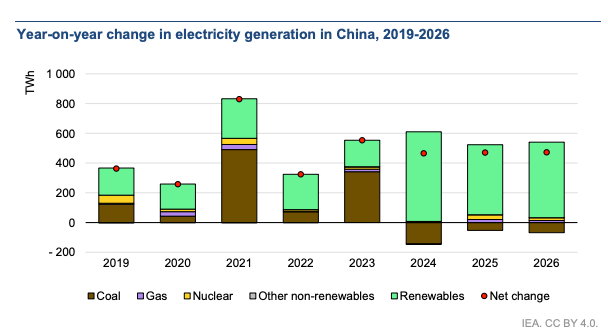
Good news! Renewable deployments are ramping on a hockey-stick trajectory. This will be familiar to readers who read my summary of the IEA’s recent Renewables report. Pretty much everyone has underestimated the pace of renewables deployment, particularly in China.
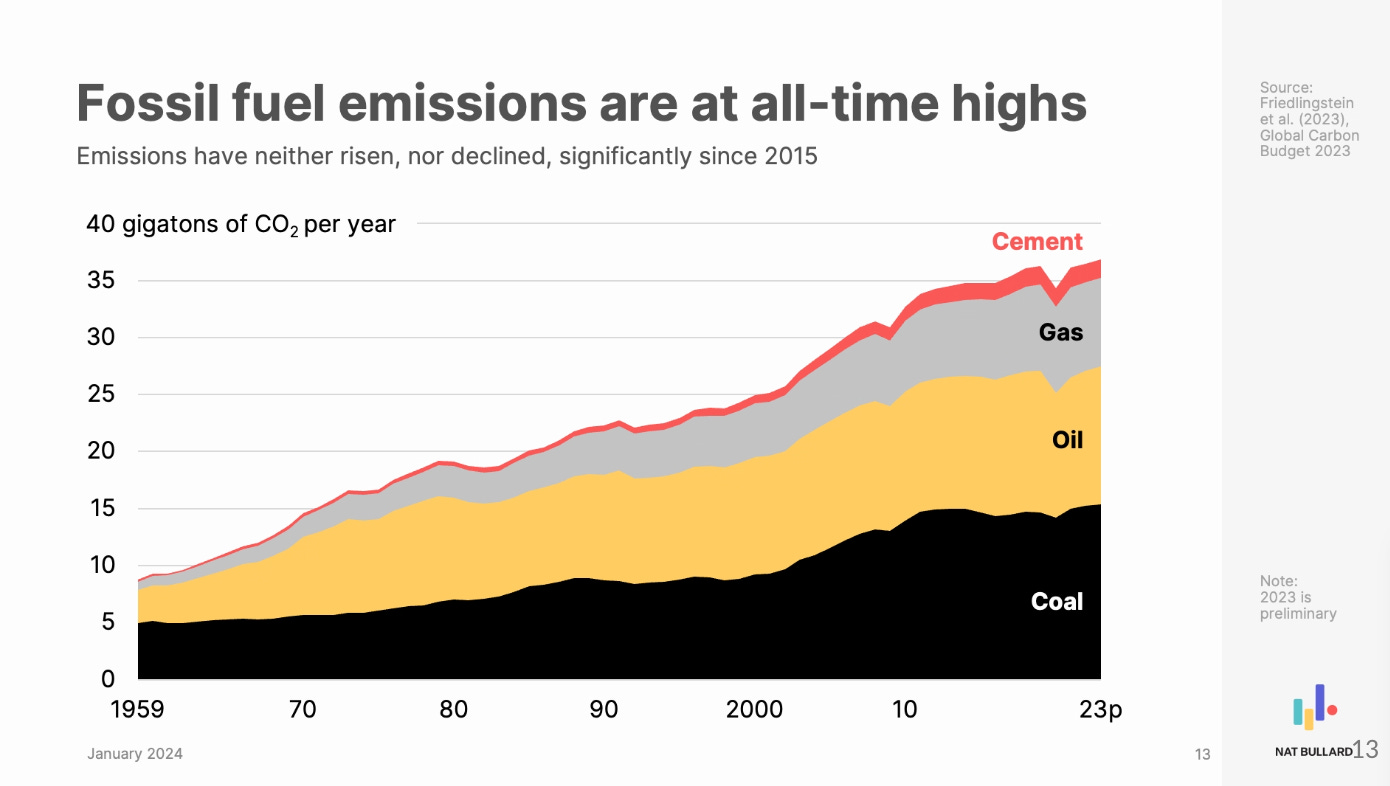
However - HOWEVER - renewables deployment is great, but, from a decarbonisation perspective, it is only a proxy for what we care about, which is fewer emissions into the atmosphere. While renewables have managed to cover the vast majority of electricity demand growth they haven’t yet put a dent in the absolute level fossil fuel demand / emissions. We need to be laser focussed on decarbonising not just on a relative basis (per unit GDP, or per capita etc), but on an absolute basis (less emissions into the atmosphere - full stop).
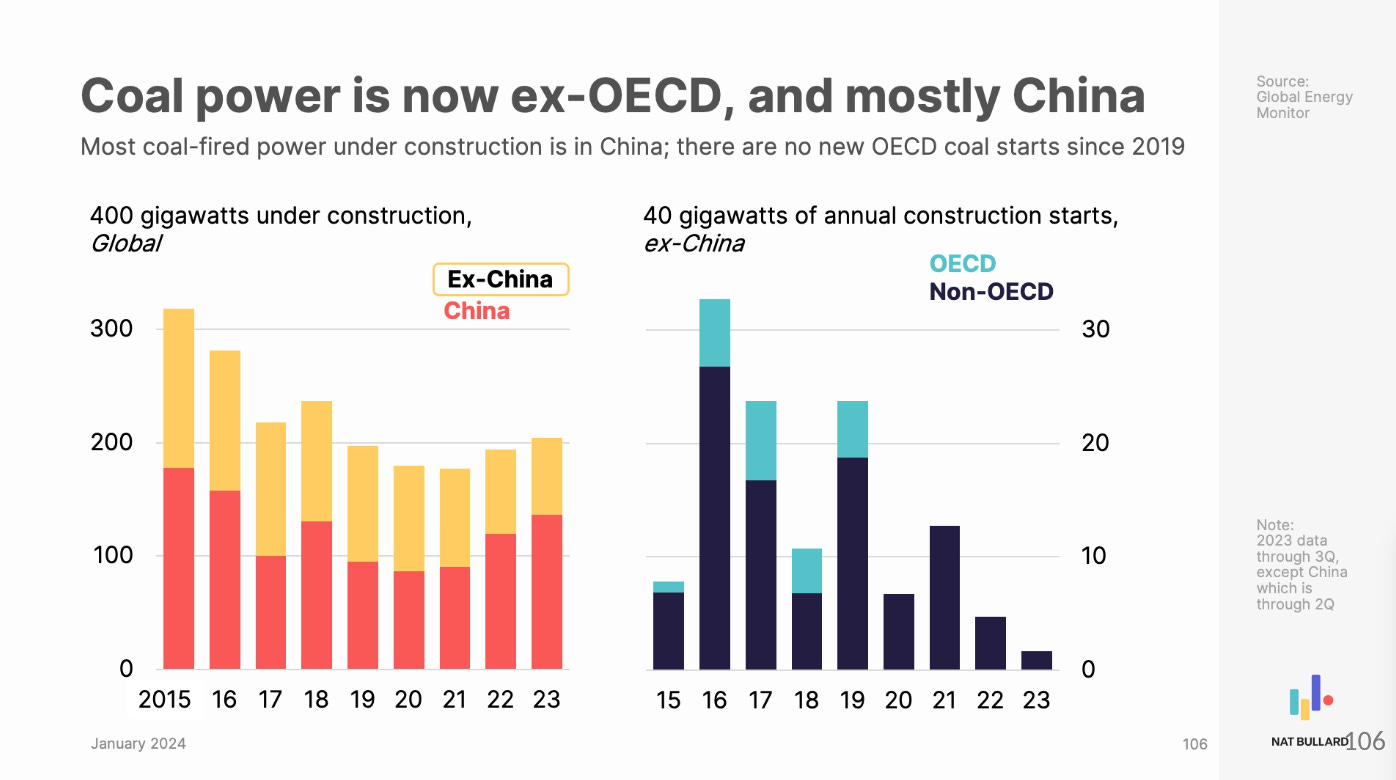
The good news is that the additions of new coal power have slowed dramatically globally, so at least the stock of fossil infrastructure to decommission is levelling off.
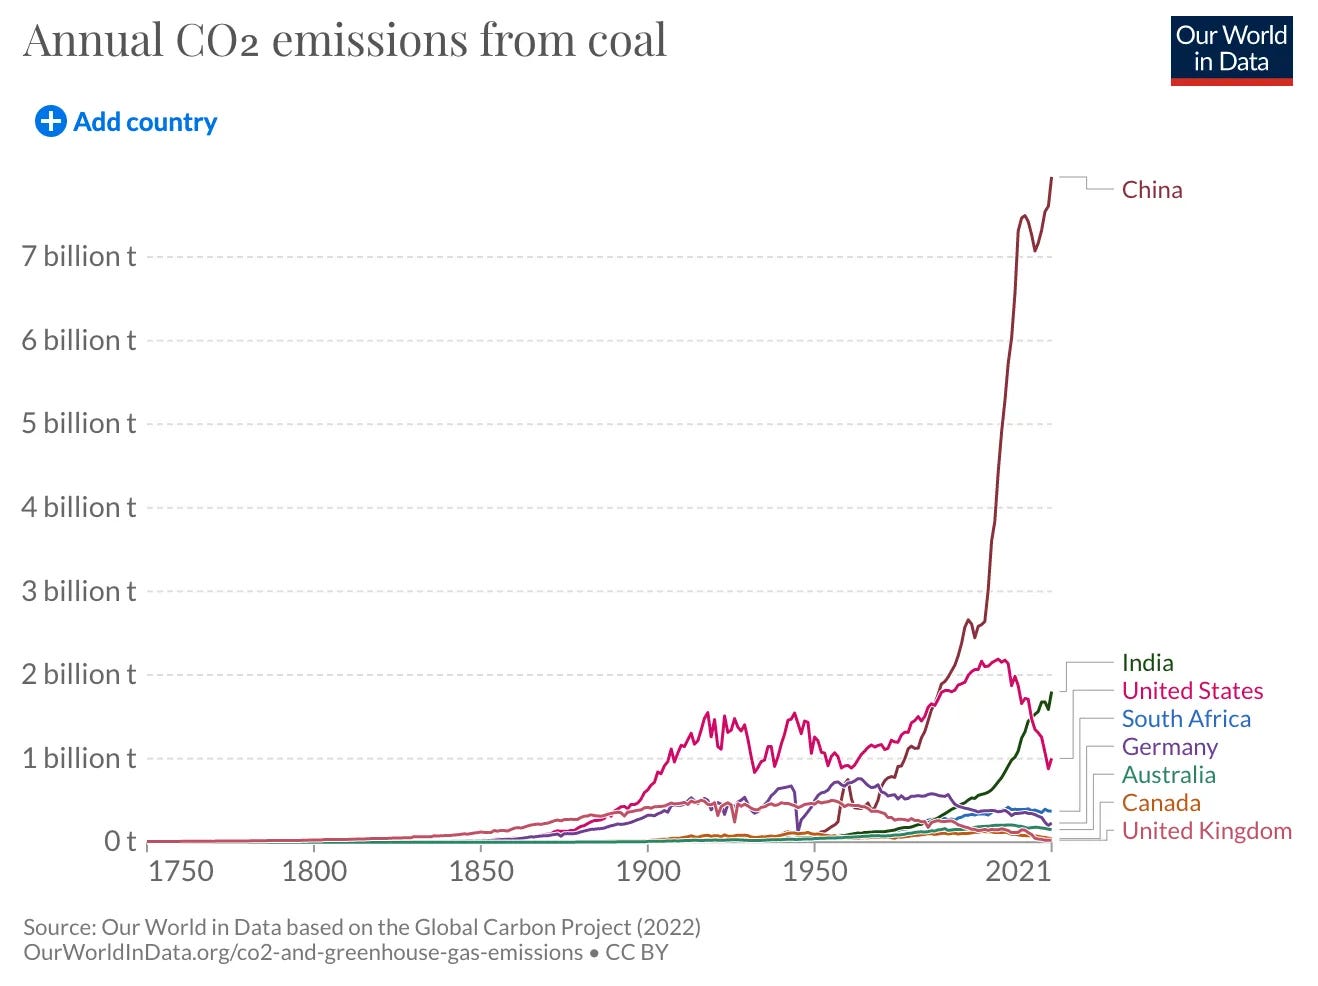
And nowhere is this more relevant than in China. This chart (not from either of the two presentations mentioned above) leaves absolutely no doubt as to what is the biggest lever we need to pull collectively. (Note that the below includes all coal use, not just in the power sector.)
So that gets us to what I think is the most important chart in these reports, showing that low-carbon generation additions are just creeping up past the recent demand growth in China. It suggests that we are on the cusp of having some new renewables edge out coal generation. (I think there might be a typo in this slide - growth rate 2010-2023 rather than 2010-2013.)
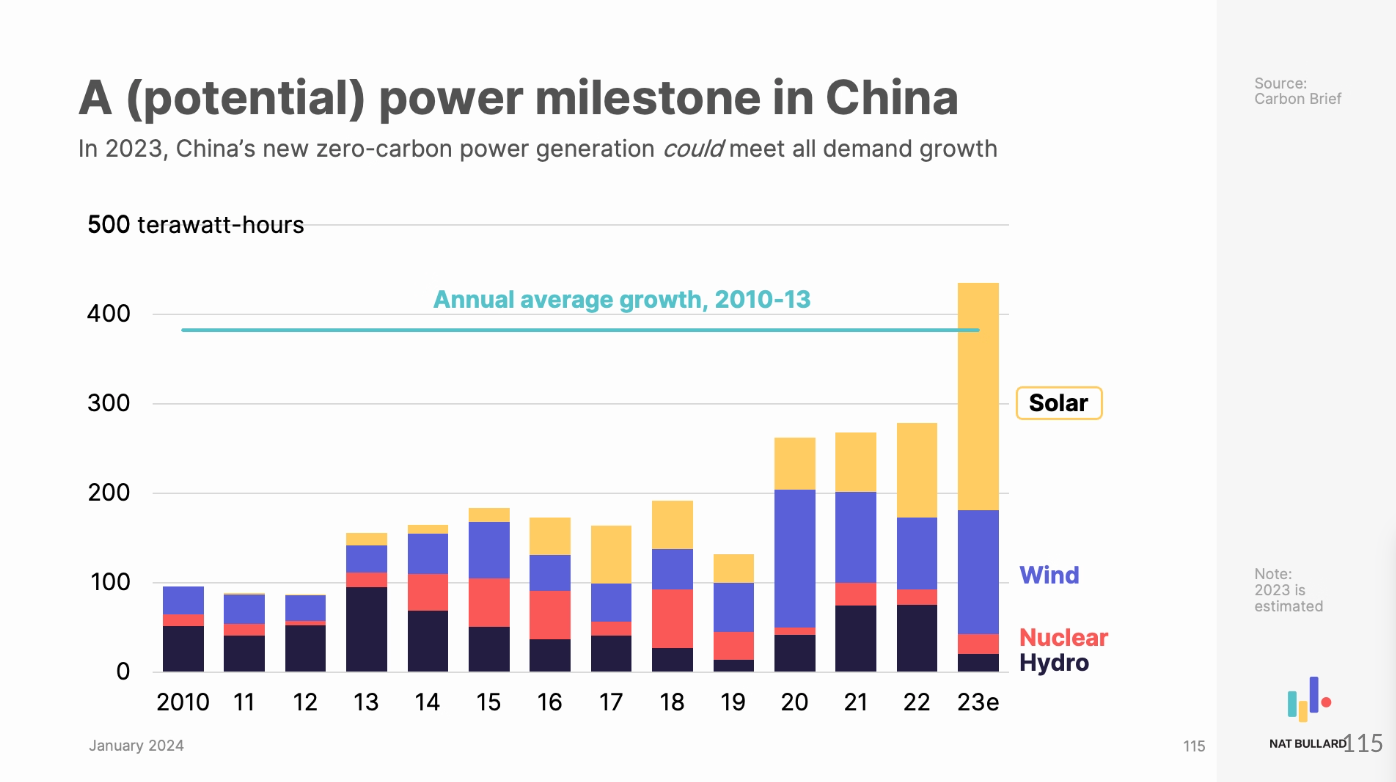
This is also the IEA’s assessment from their Electricity report (p.90), in which they note that China is moving their coal fleet increasingly to the role of peaker plants to fill intermittency, also reflected in the change to their electricity market that allows for capacity payments to coal plant operators, not just payments for electricity delivered. I personally don’t know enough about the operation of coal power plants to understand how feasible this is and what the associated decarb benefit would be. Are there inefficiencies in running a CPP like that that would erode the emissions benefits? If anyone knows, please do comment!
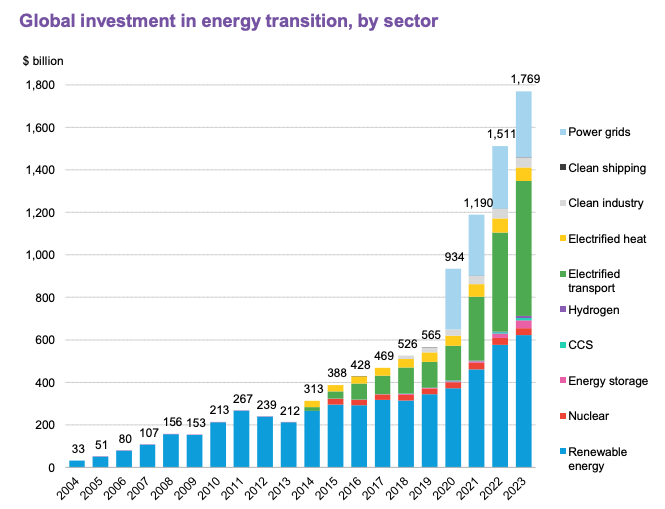
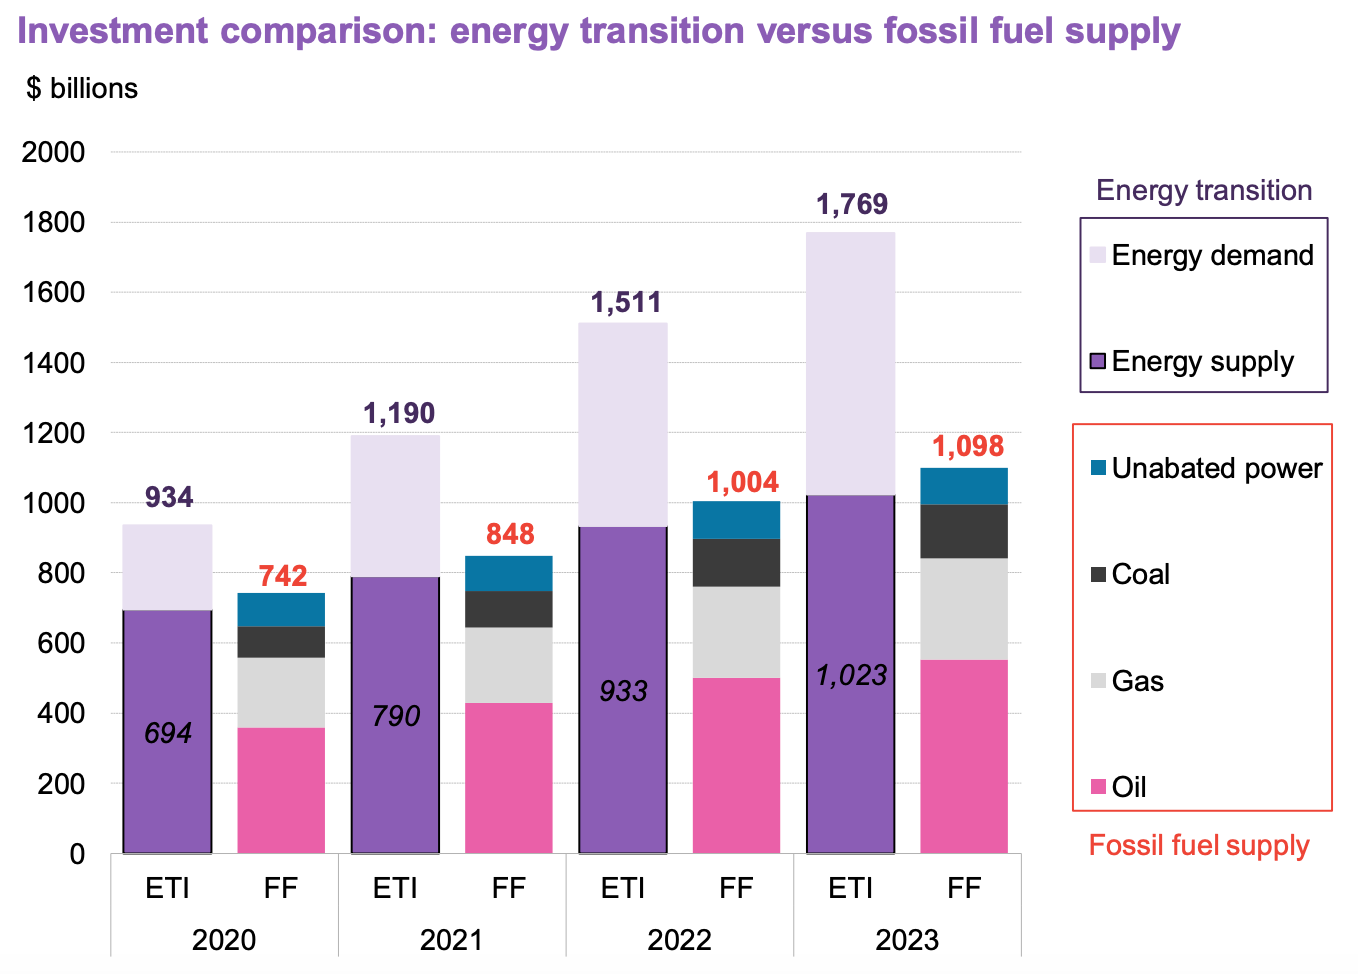
Globally, spending on energy transition grew 17% last year, driven primarily by growth in electrified transport (including the purchase of EVs), which was up 36% yoy and is now the biggest share of overall spending.
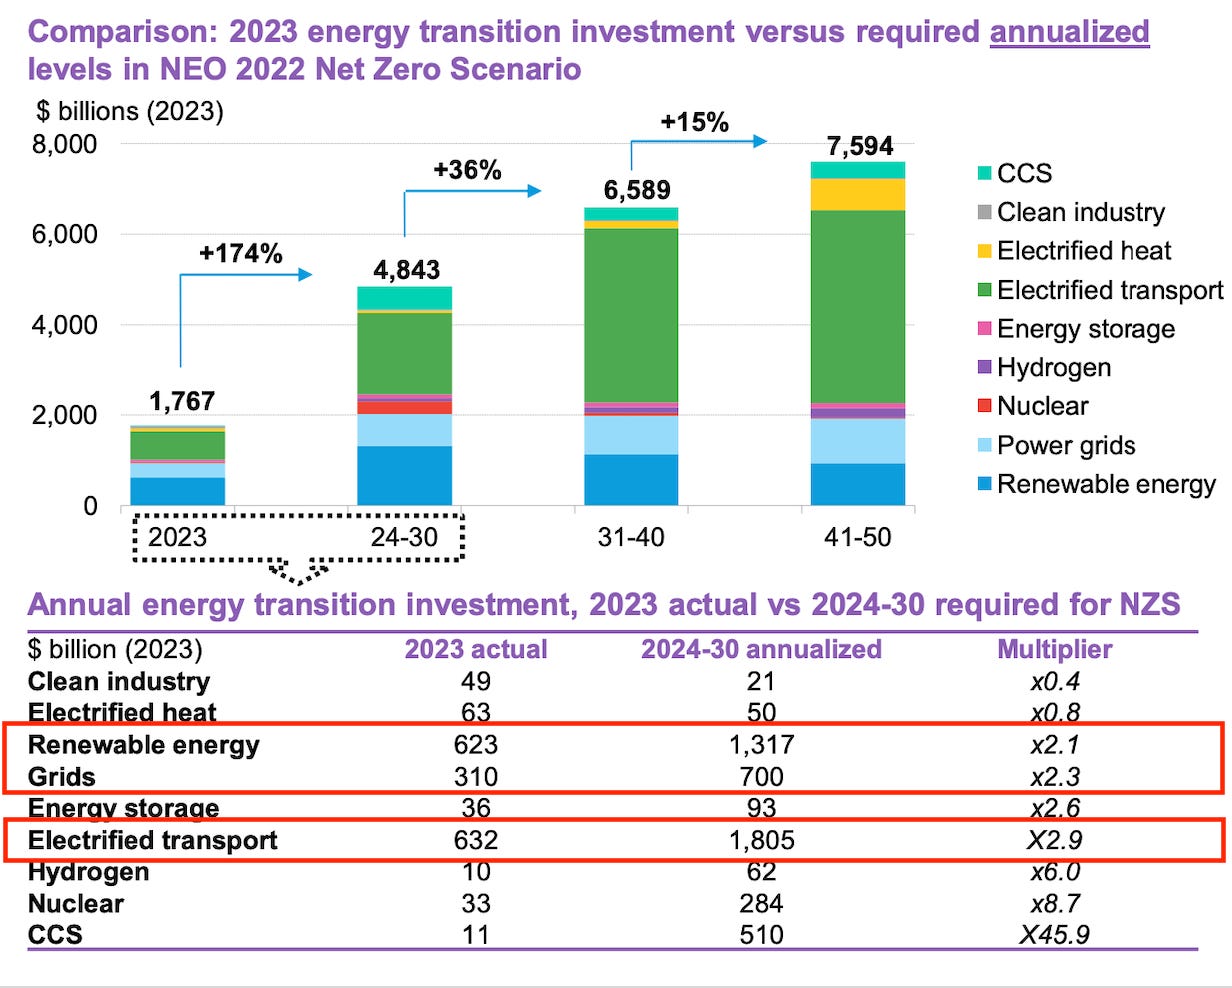
To be compatible with BNEF’s Net Zero Scenario, investment needs to be 2.75x what it is currently. However, that doesn’t actually represent that much of an acceleration. If we just replicate last year's growth of 17%, we get to an average of 2x over the rest of the decade. If we take the compounded growth over the last three years (24%), we’re pretty much there. Also, BNEF numbers have most of that growth in electrified transport. It probably is not realistic for growth rates in electrified transport to persist, but if they did, they would exceed what BNEF have under their Net Zero Scenario. Renewable energy and grids, the other two big needle-movers, need to pick up the pace.
Indeed, investment in fossil fuel supply still outstrips that of clean energy supply, with a gap of $75 billion in 2023. This puts fossil fuel supply investment 7% higher than clean supply spending – a relationship that has been broadly consistent since 2020.
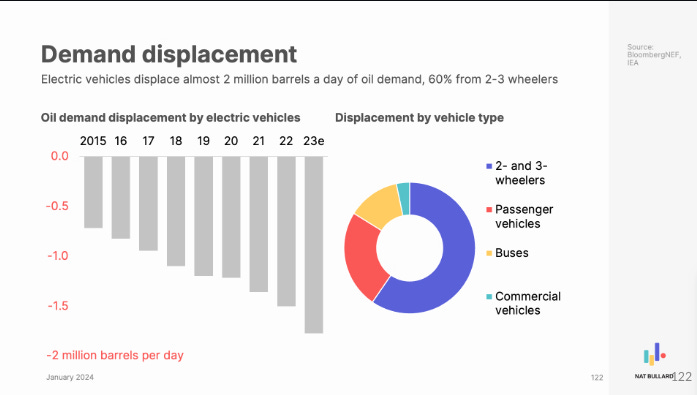
The increased adoption of EVs is starting to put a noticeable dent in oil demand growth, although, noting the first chart, it isn’t yet dropping in absolute terms. For context, the world consumes about 100 million barrels per day currently. Before seeing this chart, I was aware that 2- and 3- wheelers made up the vast majority of EVs, but I hadn’t appreciated that also translated into the majority of the oil demand displacement.
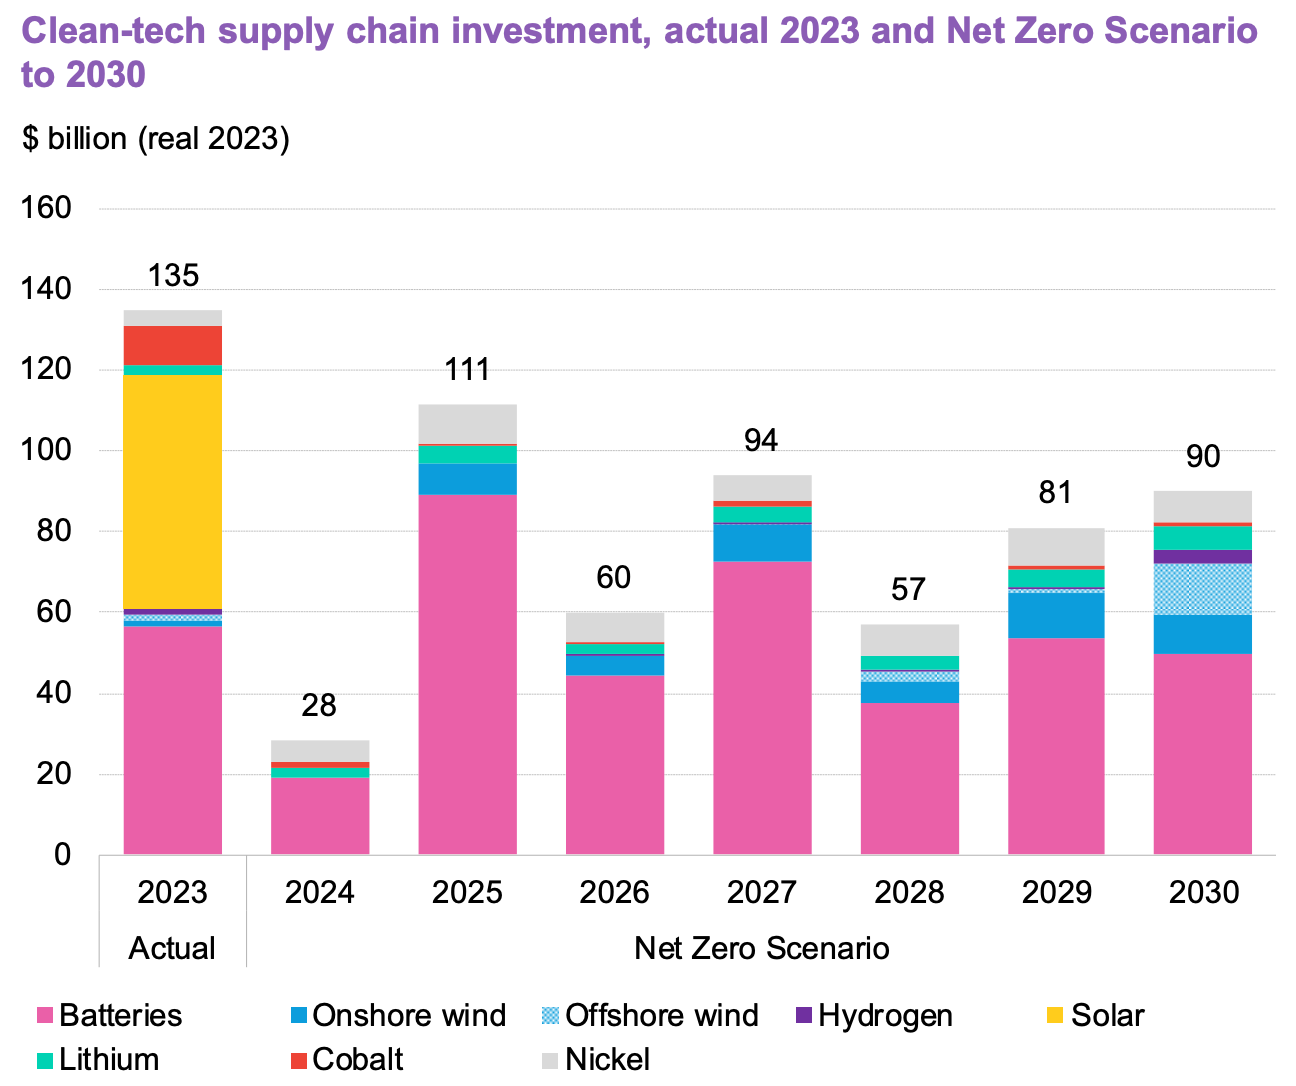
The supply chains from a manufacturing standpoint look really good from a capacity perspective (although obviously totally dominated by China). From BNEF:
Our Net Zero Scenario requires yearly spending to average just 55% of what was achieved in 2023. Strikingly, the current solar oversupply is such that no new factories are required by 2030. The supply glut will put pressure on solar module prices for years to come, and weakens the case for localizing production in markets with little existing solar manufacturing.
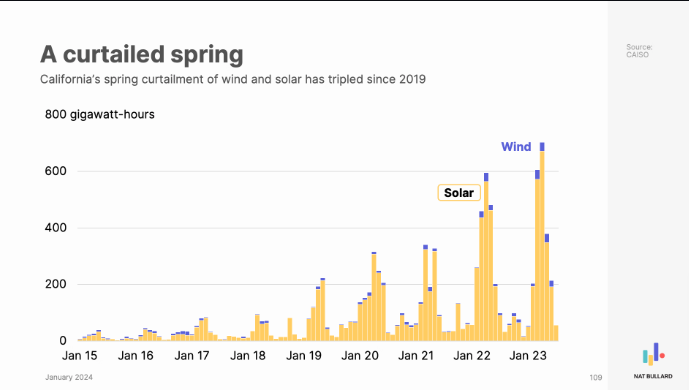
Rock bottom module costs will be a boon for solar developers then for years to come, but the grids are already feeling the strain from intermittent and, crucially, highly correlated renewables generation.
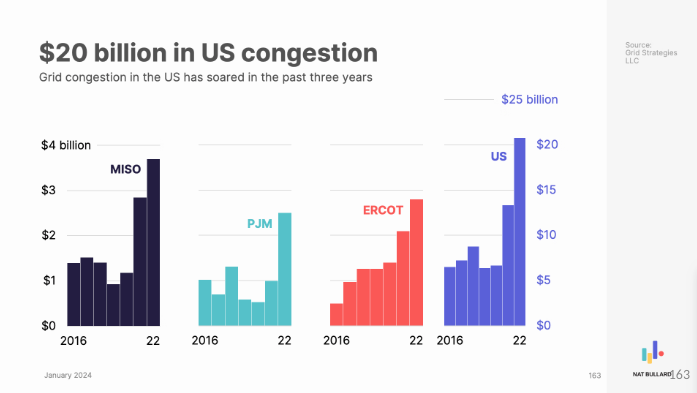
That means not only huge investments in grid infrastructure and (hopefully) new long distance HVDC transmission lines, but it also means that wind and solar assets will increasingly face curtailment. (This might see more off-grid applications, but these are a negligible part of the picture so far.)
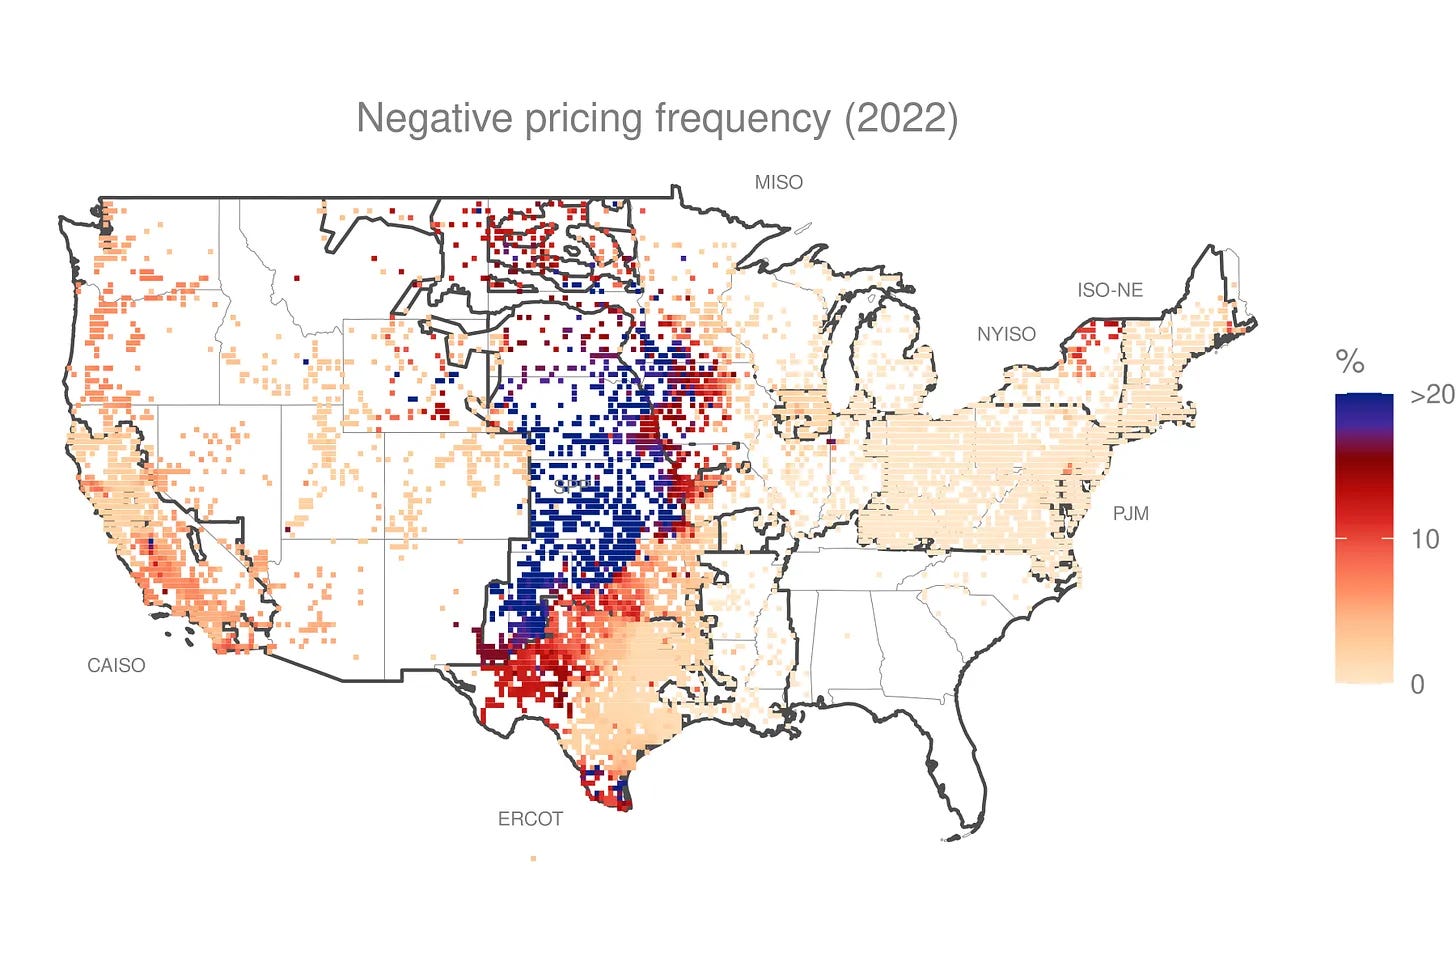
Also visible in this map from Lawrence Berkeley National Lab showing where there were negative price incidences (note wind power in the mid-West). h/t to Michael Magoon:
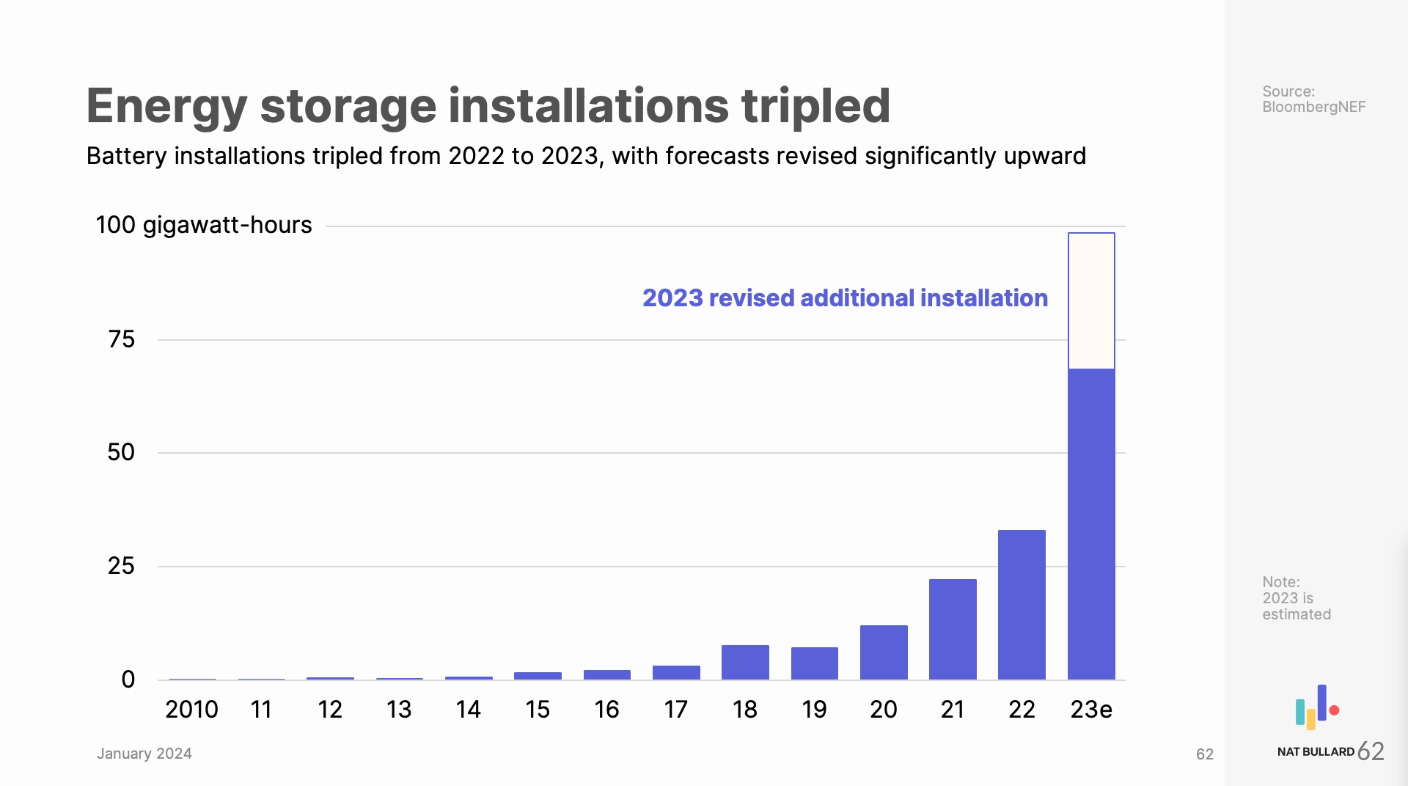
Good moment to switch to storage! This chart is interesting for two reasons. First, it shows an amazing hockey stick, demonstrating that grid-scale storage is really taking off. But, secondly, it shows just how far we have to go before we can store meaningful amounts of electricity in batteries. The entire global capacity addition of 100GwH, is less than 15 mins of the US’s electricity consumption.
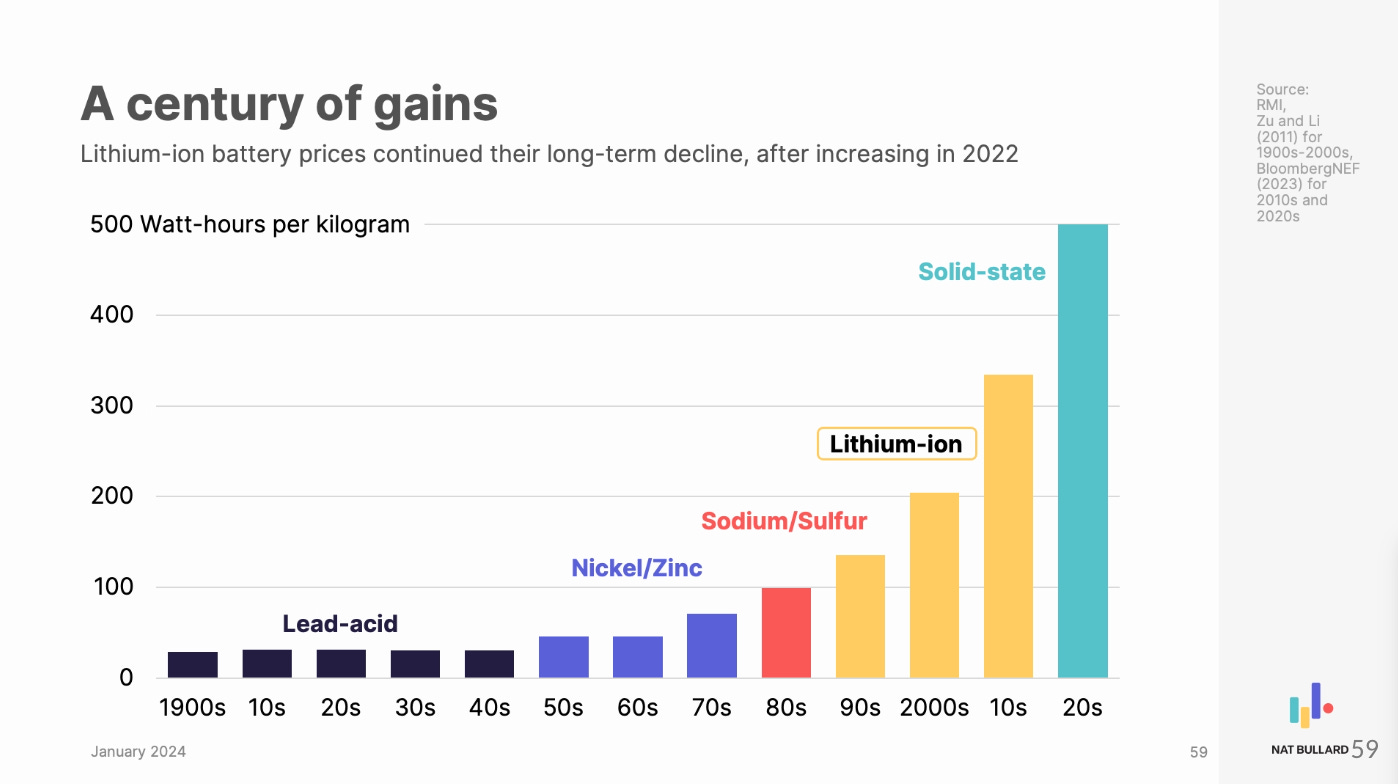
But batteries are making big improvements alongside the build out of the manufacturing base. I love this chart because it shows what we’re capable of when we apply a meaningful amount of human and financial capital to something - pretty much no energy density improvements for decades, now step-changes from one decade to the next.
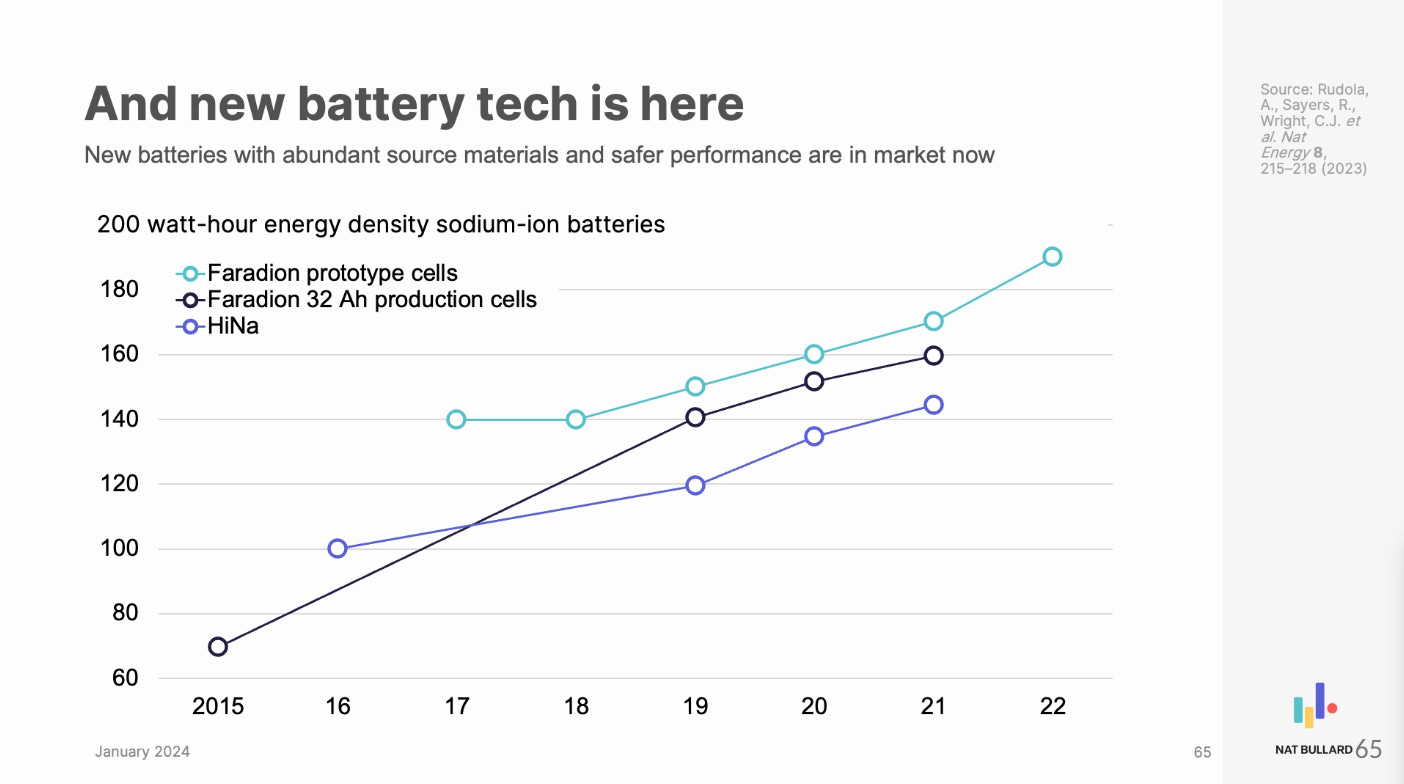
In that same vein, I found this chart showing the improved energy density of sodium-ion to be interesting, especially in light of Northvolt’s recent announcement that they are expanding into this space. They’re still quite a ways behind li-ion in terms of density, but made from earth-abundant material and could be used in stationary applications like grid storage where density isn’t an issue.
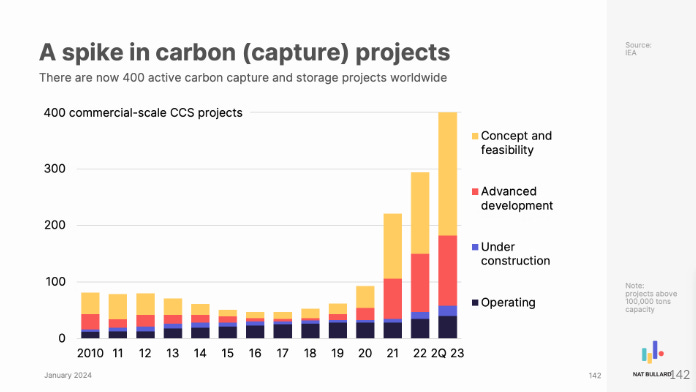
What is unfortunately very clear is that, as much progress as we are making, the stock of emitting infrastructure, together with rising energy demand from more people and higher living standards, means that it is going to be fiendishly difficult to remove large chunks of fossil fuel demand in the near term (again in absolute terms, not just relative terms). CCS, much as it might be hated by the climate left, is going to be necessary. It is finally getting some momentum, with a strong pipeline of projects (also note that investment in 2023 doubled vs 2022).
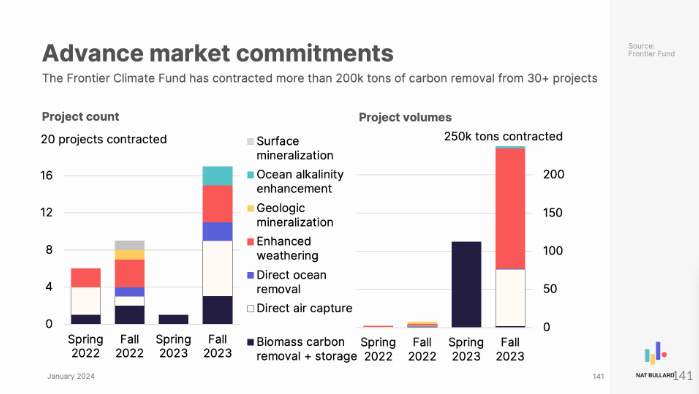
And we are going to need A LOT of CDR. It’s growing, but from a tiny base. I might also note that scaled CDR is a prospectively massive consumer of electricity, so low-carbon electricity abundance is really the killer app, which can enable everything else.
There is plenty of other good stuff in these reports - particularly Nat Bullard’s - but I’ve tried here to just pick out the charts that 1) tell the clearest story about the energy transition and 2) might be somewhat less familiar to people (I omitted those showing price declines for batteries and solar modules, for example). As always, thoughts and comments are welcome.
why so negative on coal...? there is abundant scientific literature that proves that actually LNG is "worse fro the climate" than coal if you just include methane alone. we need all reliable, affordable way to generate electricity including coal and gas, but the constant pounding on the lowest cost, and most reliable, simplest form of generation, coal... is counter productive. we need investment in, not divestment from coal and gas and other means to clean them up. as you mention in detail, there is no dent in absolute numbers... so wouldnt it be better if we would improve generation efficiencies and reduce emissions?
A "cold" coal-fueled powerplant can take more than a day to come online. Such a plant is useless for dealing with unpredictable intermittency. A "hot" coal plant with zero net generation continues to consume minimal amounts of fuel, but can respond to intermittency.